Market Cycles Explained: What Every Investor Needs to Know in 2026
Updated: May 2026 | By Jenna Lofton, StockHitter.com
Jenna’s Bottom Line
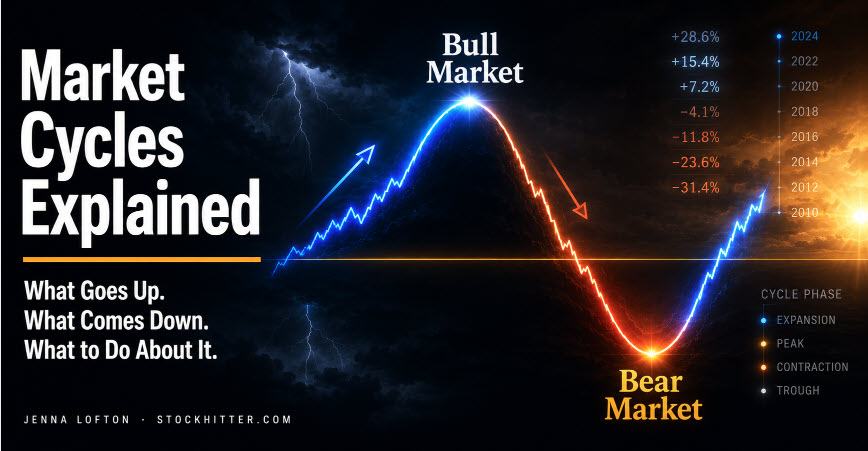
Market cycles are not random. They follow a pattern that has repeated across every generation of investors, in every major economy, for as long as markets have existed. You cannot predict exactly when each phase starts or ends. You can absolutely understand where you are in the cycle and position yourself accordingly.
Key Takeaways
- Every market cycle moves through four phases: expansion, peak, contraction, and trough. The pattern is consistent even when the timing is not.
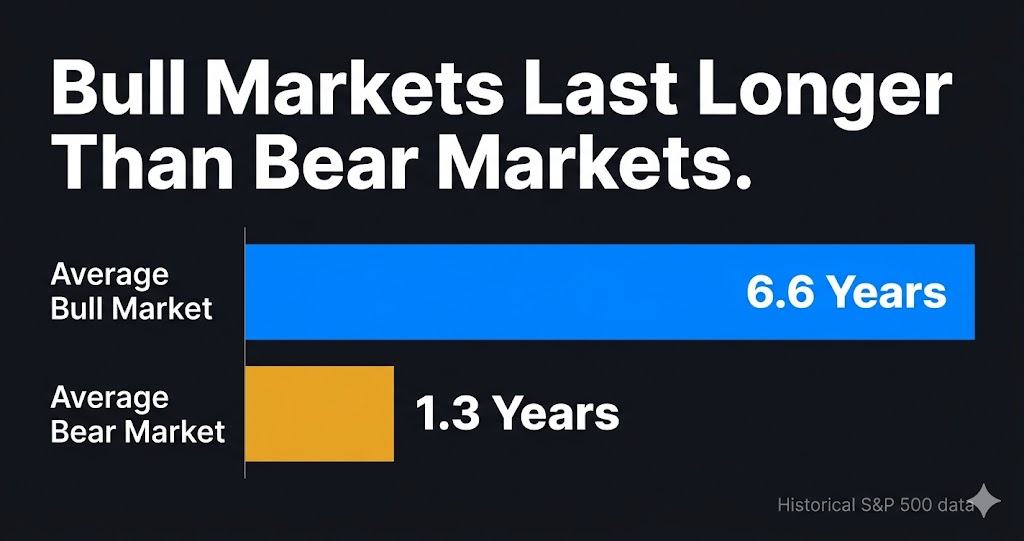
- Bull markets have historically lasted far longer than bear markets. The average bull market runs roughly 6.6 years. The average bear market lasts about 1.3 years.
- The investors who lose the most money are almost never the ones who held through downturns. They are the ones who sold at the bottom and missed the recovery.
- Fear and greed are not background noise. They are the fuel that drives cycles to their extremes.
- No indicator reliably predicts exact cycle turning points. The yield curve, credit spreads, and leading economic indicators offer useful context, not certainty.
Why Market Cycles Exist
Market cycles exist because human psychology is consistent. Greed, fear, overconfidence, and panic have driven prices above and below fair value since the first organized market opened for business.
The mechanics are straightforward. Rising earnings attract investors. Rising demand pushes prices higher. Higher prices attract even more investors until prices exceed what earnings can justify.
Then a catalyst triggers a reassessment. Prices fall. Fear drives selling. Selling drives more fear, and prices fall further than fundamentals alone would warrant. Then the cycle begins again.
This pattern has repeated through the 1929 crash, the 1987 single-day collapse, the dot-com bust of 2000, the 2008 financial crisis, and the 2020 pandemic crash. The specific triggers change. The underlying dynamic does not.
The Four Phases of a Market Cycle
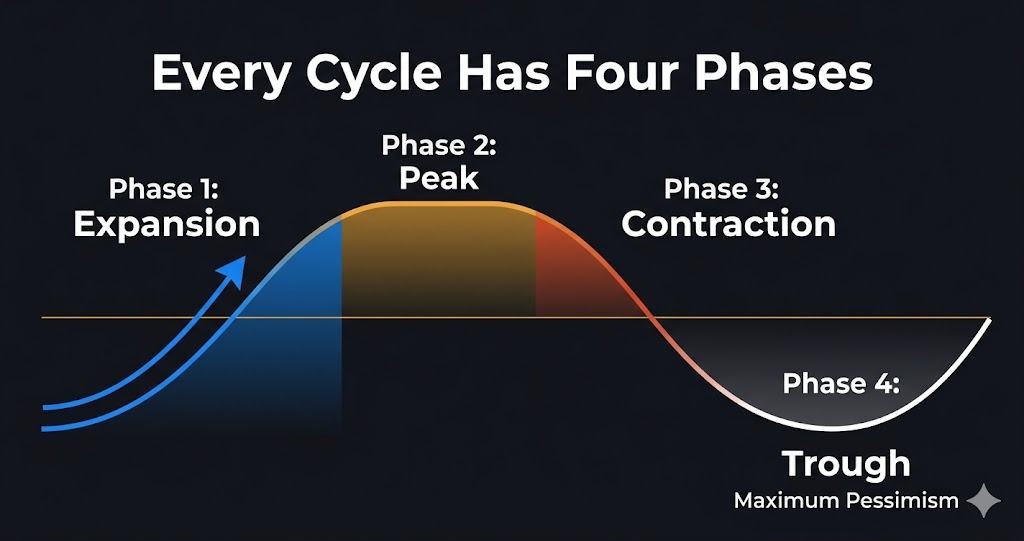
Every market cycle moves through four distinct phases. Knowing which phase you are in does not tell you exactly what to do. It tells you the context in which every investment decision is being made.
Expansion is the first and longest phase. The economy is growing, unemployment is falling, corporate earnings are rising, and credit is cheap. Stock prices rise steadily, with occasional pullbacks that get bought quickly. This is where the foundation of serious wealth is built.
The peak is the transition between expansion and contraction. It is almost never obvious in real time. Valuations are stretched, sentiment is at its most optimistic, and late-cycle investors are entering the market in large numbers. The peak is where the seeds of the next contraction are planted.
Contraction is the bear market phase. Economic growth slows or reverses, corporate earnings disappoint, and credit tightens. Prices fall sharply, and the surrounding news flow makes it feel like the decline will never end. It always ends.
The trough is the bottom of the cycle and the mirror image of the peak. Sentiment is at its most pessimistic and valuations are often at their most attractive. The investors who buy at the trough generate the best long-term returns. They are also a small minority, because buying when everything feels broken is genuinely difficult.
How Long Do Cycles Last
Bull markets last much longer than bear markets. That single fact is one of the most useful and underappreciated in all of investing.
Based on historical S&P 500 data going back to the mid-20th century:
- Average bull market duration: approximately 6.6 years
- Average bear market duration: approximately 1.3 years
- Average bull market gain: roughly 339 percent
- Average bear market loss: roughly 38 percent
An investor who holds through bear markets captures returns that dwarf those of an investor who tries to exit and re-enter. Missing just the 10 best days in the S&P 500 over any 20-year period cuts total returns roughly in half. Those best days cluster near market bottoms.
Individual cycles vary significantly from the averages. The bull market from 2009 to 2020 lasted over a decade. The bear market that followed in early 2020 lasted only about 33 days. No cycle is typical. The averages are useful context, not predictions.
The Economic Indicators That Signal Cycle Shifts
No indicator reliably predicts exact market turning points. Several have historically provided useful advance warning worth monitoring.
The yield curve is one of the most closely watched. When short-term Treasury yields rise above long-term yields, the resulting inversion has preceded recessions with significant historical reliability. The Federal Reserve Bank of St. Louis tracks the 10-year minus 2-year Treasury spread in real time. The lag between inversion and recession has historically ranged from 6 to 24 months.
Credit spreads measure the yield difference between corporate bonds and Treasuries of the same maturity. Widening spreads signal institutional caution about credit risk. That caution typically precedes equity market weakness.
Leading economic indicators from the Conference Board aggregate 10 data points including manufacturing orders, building permits, and consumer sentiment. The index is designed to signal turning points 3 to 6 months in advance. It is imperfect but consistently useful as one input among many.
Corporate earnings revisions are the most direct signal. When analysts broadly revise S&P 500 earnings estimates downward, the direction of the revision cycle is often more reliable than the absolute earnings level.
Bull Markets: What They Are and How They End
A bull market is a sustained rise of 20 percent or more from a recent low. In practice, bull markets are extended periods of rising prices, improving economic conditions, and growing confidence, punctuated by corrections that resolve upward.
Bull markets end for a small number of recurring reasons:
- Monetary tightening. When the Federal Reserve raises interest rates to cool inflation, growth slows, valuations compress, and the conditions supporting rising earnings deteriorate. The 2022 bear market is a direct example.
- Exogenous shocks. The 2020 pandemic bear market was caused by a sudden external disruption, not economic deterioration. These bear markets are typically shorter because the underlying economic infrastructure often remains intact.
- Valuation excess. When prices rise far above any earnings-based justification, correction becomes mathematically inevitable. The dot-com bust of 2000 to 2002 is the clearest modern example.
For a detailed breakdown of the bull and bear market distinction, see our full guide to bull markets vs. bear markets.
Bear Markets: What They Are and How to Survive Them
A bear market is a decline of 20 percent or more from a recent high, sustained over at least two months. That definition matters because a sharp drop that recovers quickly feels very different from a grinding 18-month decline like 2007 to 2009.
The practical experience of a bear market is one of the hardest tests any investor faces. Every piece of financial news is negative. Analysts revise price targets downward. The psychological pressure to sell and stop the pain is enormous and relentless.
The investors who survive bear markets with their wealth intact share one characteristic. They had a framework before the bear market started. They knew what they owned, why they owned it, and what would have to be true for their thesis to be wrong.
For a deeper look at what causes the most severe bear markets, see our guide to what causes stock market crashes.
Experience Transparency
I have been through four significant market downturns as an active investor. The 2008 financial crisis taught me the most, not because of what I did right but because of what I did wrong. I sold positions in late 2008 after watching them decline 40 percent, convinced the bottom was nowhere near. The market bottomed in March 2009, two months later. What followed was the longest bull market in recorded history. That experience made me permanently committed to having a framework before a downturn starts, not during one.
Corrections: The Cycle’s Most Misunderstood Feature
A correction is a decline of 10 to 20 percent from a recent high. Corrections are not bear markets. They are normal, recurring features of healthy markets that happen several times per decade and resolve upward the vast majority of the time.
The problem is that corrections feel like bear markets while they are happening. Investors who cannot distinguish between the two sell during corrections and miss the recovery. That is one of the most expensive mistakes in investing.
Since 1950, the S&P 500 has experienced roughly 38 corrections of 10 percent or more. The index has recovered from all of them. For a full breakdown, see our guide to what is a market correction.
Where Investors Go Wrong in Every Cycle
The behavioral mistakes that destroy returns in market cycles follow a consistent pattern. They repeat across every generation of investors with remarkable fidelity.
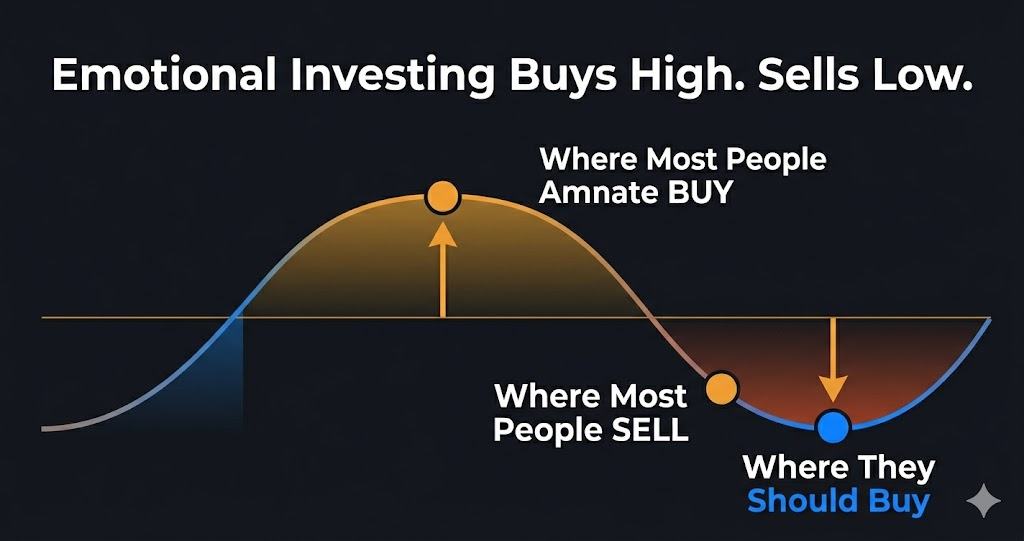
- Buying late. Retail investor fund flows consistently show money pouring into equity funds after extended periods of strong performance, near market peaks. These investors are buying at exactly the wrong moment.
- Selling late. The same investors hold through early declines until losses become psychologically unbearable. By the time they sell, the market is often near its trough. They realize the losses and miss the recovery.
- Waiting for certainty. After selling near the bottom, most investors wait for the recovery to be confirmed before buying back in. By the time that confirmation is visible, prices have already risen 20 to 30 percent from the trough.
The result is a cycle of buying high and selling low that repeats indefinitely for investors without a framework to override their instincts.
Wall Street Reality Check
Every bear market in history has been accompanied by a credible argument that this time is different and the recovery will not come. In 2009 the argument was that the global financial system had been permanently impaired. In 2020 it was that the pandemic had structurally ended economic normalcy. In 2022 it was that inflation was embedded and the Fed would crush growth indefinitely. Every argument was sophisticated, backed by serious analysts, and wrong about the long-term trajectory. The narrative at the bottom of every cycle is designed by circumstances to feel like the end. It never is.
How to Position Across the Cycle
Knowing which phase you are in should influence how you invest, even if it does not change what you own.
- Early expansion. Risk appetite is rewarded. Small caps, cyclical sectors, and beaten-down growth companies tend to outperform as credit conditions ease and pessimism from the prior contraction still depresses valuations.
- Mid expansion. Quality compounds. Large-cap growth companies with durable competitive advantages perform well. Index funds do their job effectively.
- Late expansion and peak. Defensiveness becomes more valuable. Consumer staples, utilities, healthcare, and dividend-paying companies hold value better when growth slows.
- Contraction. Cash and defensive positioning matter. Investors who enter bear markets with meaningful cash reserves can buy at prices that fully-deployed investors cannot access.
For a practical framework on investing specifically during recessions, see our full guide to how to invest in a recession.
Market Cycles and the AI Infrastructure Thesis in 2026
Understanding the current market cycle matters for evaluating the AI infrastructure investment theme that has dominated equity markets since 2023.
The AI infrastructure build-out represents a structural demand cycle layered on top of the broader economic cycle. Hyperscalers including Microsoft, Alphabet, Meta, and Amazon have committed hundreds of billions of dollars annually to AI infrastructure. That spending is largely non-discretionary at this point.
Companies supplying the compute, networking, and software layers of AI infrastructure have demand visibility relatively insulated from normal economic cycle dynamics. Palantir Technologies (PLTR) and Arista Networks (ANET) are examples of companies whose revenue growth is driven more by this structural cycle than by the traditional economic cycle.
That does not make them immune to a broad market downturn. In a contraction phase, even structurally sound businesses get sold as investors raise cash. But a recession-driven decline would likely create buying opportunities in AI infrastructure names rather than signal deterioration in their underlying business thesis.
For our full analysis of this theme, see best AI infrastructure stocks to watch in 2026.
The One Framework That Survives Every Cycle
After 15 years of watching markets move through expansions, peaks, contractions, and recoveries, the framework that holds up best is the simplest one.
- Own great businesses.
- Know why you own them.
- Know what would have to be true for that thesis to be wrong.
- Add to positions when prices fall and the thesis is intact.
- Reduce positions when valuations exceed what the earnings trajectory can justify.
That framework does not require predicting cycle turning points. It requires understanding what you own well enough to hold through noise and act when the market creates opportunities.
For investors who want a structured research framework to support cycle-aware investing, the Oxford Communiqué takes a long-term approach explicitly designed to hold positions across multiple market cycles rather than react to short-term volatility.
Bottom Line
Market cycles are predictable in pattern and unpredictable in timing. The four phases of expansion, peak, contraction, and trough repeat reliably across every generation of investors and every major economy. The investors who build real wealth are not the ones who predict turning points correctly. They are the ones who understand the pattern well enough to stay positioned for long-term compounding while everyone around them is reacting to short-term noise. Build the framework before the next downturn starts. You will need it when you need it most.
Further Reading
Disclaimer: This article is for informational and educational purposes only and does not constitute financial advice. StockHitter.com and Jenna Lofton are not registered investment advisors. All investing involves risk, including the potential loss of principal. Past performance does not guarantee future results. Always conduct your own due diligence and consult a licensed financial professional before making investment decisions. Jenna Lofton holds a position in PLTR. Some links on this page may be affiliate links, meaning StockHitter.com may receive compensation if you subscribe to a service at no additional cost to you. This does not influence our editorial opinions.