

Updated: July 31, 2026 | By Jenna Lofton, StockHitter.com
Jenna’s Bottom Line
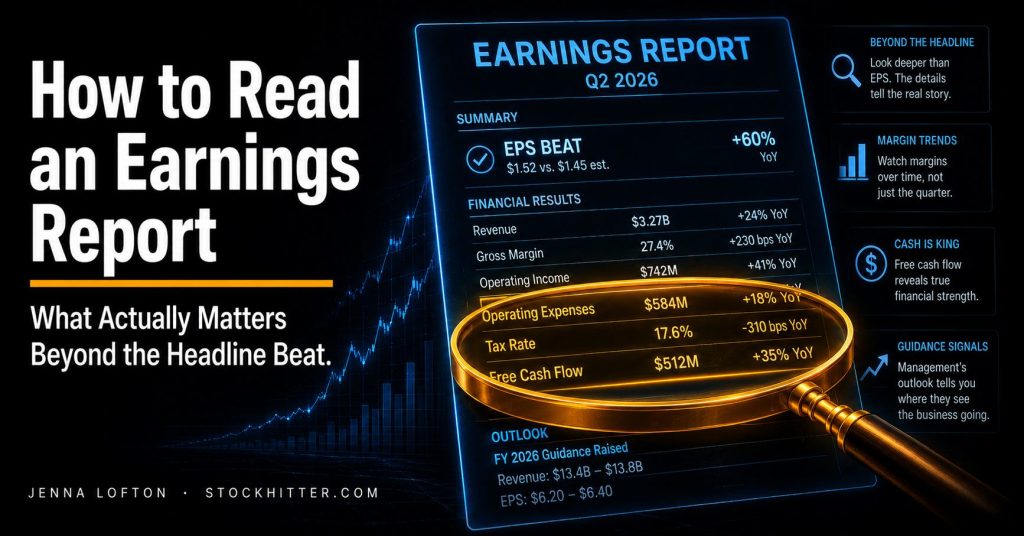
A great earnings report and a rising stock price are not the same thing, and confusing the two is the single most common mistake I see investors make every earnings season. The headline EPS beat or miss tells you almost nothing on its own. What actually moves a stock, and what you should actually be reading for, lives in the details most people skip past.
Key Takeaways
- The five metrics that matter, in order: revenue versus consensus, EPS versus consensus, margin trends, cash flow, and forward guidance. Skipping any one of these produces an incomplete picture.
- Stocks react to surprise, not results. A quarter can be genuinely strong and the stock can still fall if guidance disappoints or if the beat was smaller than what was already priced into the stock.
- EPS beats can be manufactured through buybacks, tax rate changes, and one-time accounting items. Revenue is a cleaner signal of real demand than EPS alone.
- Guidance often carries more weight than the quarter that already closed. A strong quarter paired with a guidance cut can produce a sharply negative stock reaction despite the historical beat.
- The earnings call matters as much as the press release. Management’s tone, how they handle tough analyst questions, and specific language around demand and backlog reveal more than the prepared remarks alone.
The Five Things I Check, In Order
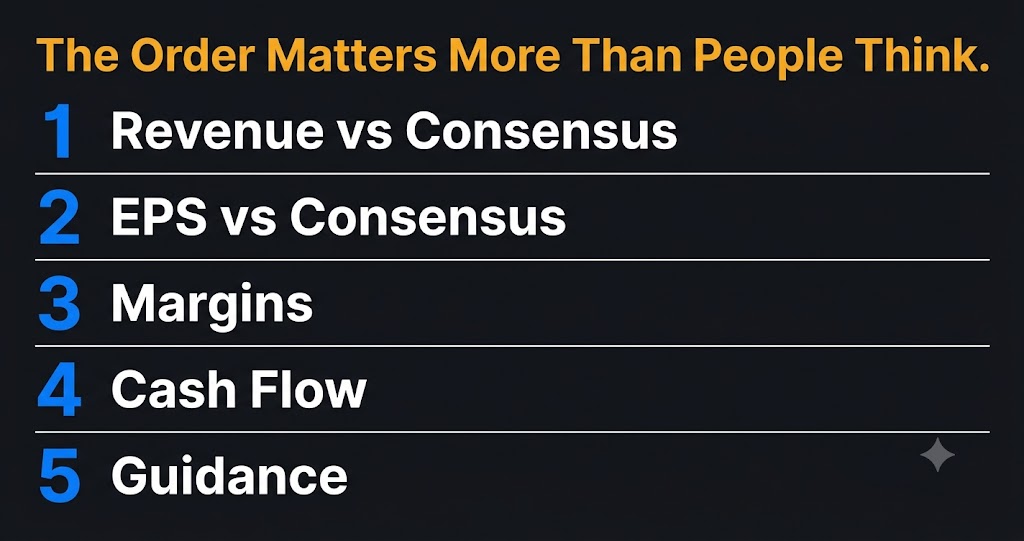
Every earnings report contains dozens of numbers. Most of them do not matter. Here is the sequence I actually run through every single time, and the order is deliberate.
First, revenue versus consensus. Revenue is the cleanest measure of real demand because it is much harder to manipulate through accounting choices than earnings. Check both the absolute growth rate year over year and whether it beat or missed the analyst consensus estimate tracked by services like Zacks. A deceleration from 25 percent growth to 18 percent growth is more significant than the absolute number in isolation.
Second, EPS versus consensus. Earnings per share matters, but with an important caveat: EPS can be affected by share buybacks, tax rate changes, one-time items, and accounting adjustments in ways that revenue cannot. If EPS beats but revenue misses, the company likely improved profits through cost control rather than genuine business growth. That distinction changes how sustainable the beat actually is.
Third, margin trends. Gross margin, operating margin, and net margin reveal whether a business is becoming more efficient or facing cost pressure. Margin expansion alongside revenue growth is one of the strongest signals of genuine operating leverage. Margin compression during a growth phase deserves scrutiny into whether that growth is sustainable.
Fourth, cash flow. Operating cash flow and free cash flow confirm earnings quality. If reported profit rises but cash flow weakens, examine receivables, inventory, capital expenditure, and one-time items before trusting the headline profit number. For our full framework on this metric, see our guide to free cash flow valuation.
Fifth, guidance. Management’s forward outlook for revenue, margins, or earnings in coming quarters. This is where the stock reaction usually gets decided, and it deserves as much weight as the entire rest of the report combined.
Why Stocks Fall on Good News
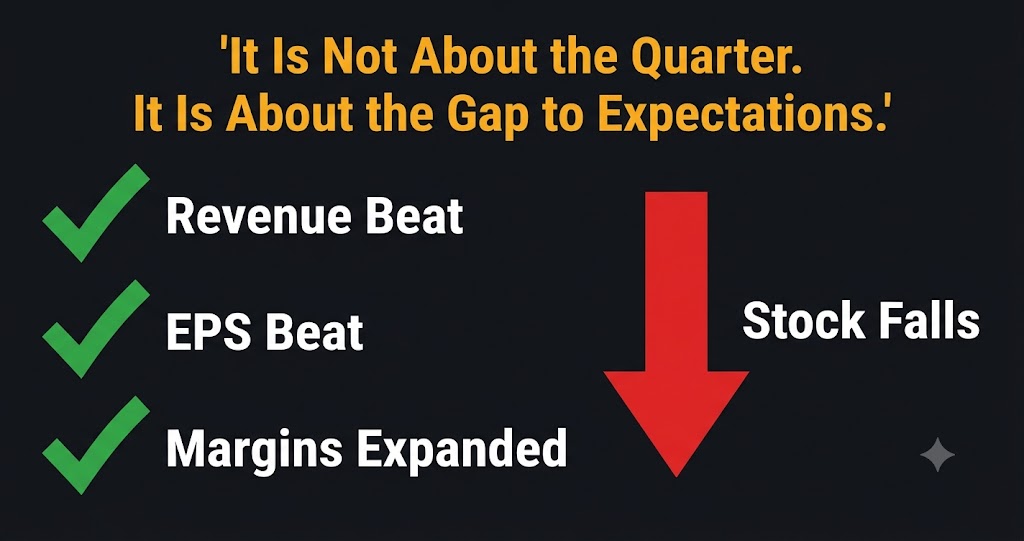
This confuses new investors more than anything else about earnings season, and it is worth explaining clearly. Billionaire investor Ken Fisher has spent decades making this exact point: it is not earnings changes that cause stock price changes, but earnings changes that come as a surprise.
Markets price in expectations before a report is even released. If a company was expected to grow revenue 30 percent and it grows 32 percent, that beat might already be reflected in the stock price heading into the report if sentiment was running hot. The size of the beat relative to what was already priced in matters more than the beat itself.
Guidance is the most common trigger for a beat-and-drop reaction. A company can report a genuinely strong quarter and still see its stock fall sharply if forward guidance disappoints, because guidance shapes expectations for every future quarter, not just the one that already closed. We covered a real example of exactly this dynamic in our Vertiv (VRT) earnings update, where the stock fell roughly 12 percent despite an EPS beat and a raised full-year guide, purely because revenue missed consensus on a timing basis.
Positioning is the other overlooked factor. A stock with heavily crowded long positioning going into earnings can sell off even on solid results, simply because there are more sellers than buyers once the immediate catalyst has passed. A stock priced for disappointment can rally on results that merely meet expectations. Reading the numbers alongside what the market was already expecting explains most of the confusing post-earnings moves that otherwise look irrational.
How to Read the Earnings Call, Not Just the Press Release
The press release and slide deck are prepared, rehearsed, and designed to present the quarter in the most favorable light possible. The real insight usually lives in the question and answer portion of the earnings call, where management has to respond to unscripted analyst questions in real time.
Listen for specific language patterns. Management teams that speak in concrete, contracted terms, backlog figures, signed customer commitments, specific dollar amounts, are describing a business with genuine visibility. Management teams that speak in vague, directional terms, strong demand, positive momentum, encouraging trends, without anchoring to specific numbers are often signaling less certainty than the tone suggests.
Pay attention to how management handles pushback. A CEO who directly engages with a tough analyst question about margin pressure or slowing growth is generally more trustworthy than one who deflects or redirects to a talking point. Hesitation, over-qualification, or a subtle shift in guidance language during the Q&A often reveals more than anything in the prepared remarks.
Red Flags That Hide Inside a Good-Looking Report
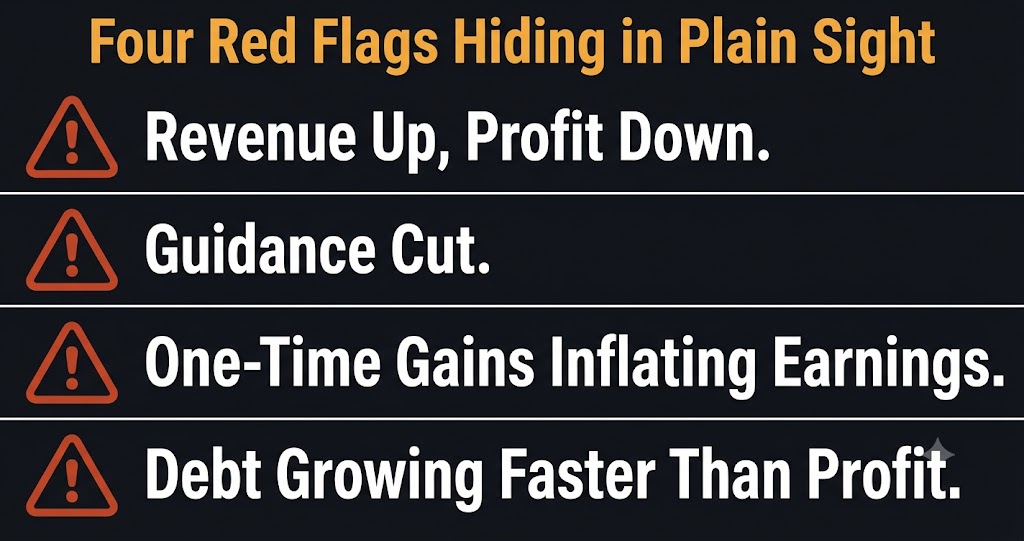
Some of the most dangerous earnings reports look strong on the surface. Here is what I specifically watch for:
- Revenue up, profit down. This combination often signals rising costs or weakening cost control. It is worth understanding whether the cost increase is temporary or structural before drawing conclusions.
- Declining guidance. A guidance cut signals the company itself expects weaker performance ahead, and management typically has better visibility into their own business than any outside analyst.
- One-time gains inflating earnings. Asset sales, litigation settlements, or favorable one-time accounting adjustments can make a quarter look stronger than the underlying business actually performed. Always check for unusual or non-recurring items in the earnings release.
- Debt growing faster than profit. If a company’s debt load is expanding faster than its earnings, financial risk is increasing even if the current quarter looks fine on the surface.
Experience Transparency
I got burned early in my career by a company that beat EPS estimates for three consecutive quarters while operating cash flow quietly deteriorated the entire time. The EPS beats were real on paper, driven by aggressive share buybacks that shrank the share count rather than genuine earnings growth. By the time the market caught on to the cash flow gap, the stock had already fallen significantly. I now check the cash flow statement before I let myself get excited about any EPS beat. A rising EPS number funded by financial engineering rather than real business performance is one of the most common ways good-looking earnings reports mislead investors.
Real Examples: Reading Recent Earnings Reports
Applying this framework to actual reports makes the process concrete. Nvidia (NVDA) reported Q1 fiscal 2027 revenue of $81.6 billion, up 85 percent year over year, comfortably beating consensus estimates of $78.8 billion. Data center revenue reached $75.2 billion, representing 92 percent of total sales. Despite this beat, the stock fell after the report on a buy-the-rumor, sell-the-news dynamic, because the stock had already run up significantly ahead of the print and expectations were priced for a massive beat rather than merely a strong one.
Broadcom (AVGO) offers a cleaner example of the framework working as intended. The company reported Q1 fiscal 2026 revenue of $19.3 billion, up 29 percent year over year, with AI semiconductor revenue up 106 percent. Management simultaneously raised guidance and expanded margins, and the stock reaction reflected the strength of the underlying report because the results genuinely exceeded what was priced in across every metric in the framework above, not just the headline number.
For our full analysis of the AI infrastructure earnings cycle, see our guide to best AI stocks to buy in 2026.
Where to Actually Find the Report
You do not need to read every line of a 200-page 10-K to understand a quarter. Focus on three sources in this order. The press release covers the headline numbers, segment breakdowns, and management’s official framing. The earnings call transcript reveals the unscripted detail described above. The 10-Q or 10-K filing, available directly through the SEC’s EDGAR full-text search system, is where you find the full cash flow statement, balance sheet, and the notes that disclose one-time items and accounting policy changes that the press release may not emphasize.
For investors who want a systematic research service that reads through this level of detail and flags the accounting nuances that standard earnings coverage misses, Hidden Alpha from Joel Litman applies Uniform Accounting methodology specifically designed to catch the kind of earnings quality issues, one-time gains, buyback-driven EPS growth, and cash flow divergences, that this article covers as red flags.
Wall Street Reality Check
Financial media coverage of earnings season overwhelmingly focuses on the single headline number: did the company beat or miss EPS. That framing is simple, generates a clean narrative, and is frequently the least informative part of the entire report. Guidance, margin trends, and cash flow quality routinely matter more to the actual investment case than whether EPS came in two cents above or below consensus. The investors who consistently misread earnings season are the ones reacting to the headline alone. The ones who read the full picture, revenue quality, margin direction, cash flow confirmation, and forward guidance together, are the ones who understand what actually happened in the quarter rather than what the headline claims happened.
Bottom Line
Reading an earnings report well means checking revenue, EPS, margins, cash flow, and guidance in that order, then confirming the story with what management actually says under pressure on the earnings call. A single headline beat or miss tells you almost nothing on its own. The stocks that surprise investors most on earnings day are almost always the ones where someone skipped straight to the EPS number and never checked whether the rest of the report actually supported it.
Further Reading
Disclaimer: This article is for informational and educational purposes only and does not constitute financial advice. StockHitter.com and Jenna Lofton are not registered investment advisors. All investing involves risk, including the potential loss of principal. Past performance does not guarantee future results. Always conduct your own due diligence and consult a licensed financial professional before making investment decisions. Jenna Lofton holds positions in PLTR and NBIS. Some links on this page may be affiliate links, meaning StockHitter.com may receive compensation if you subscribe to a service at no additional cost to you. This does not influence our editorial opinions.