

Updated: July 30, 2026 | By Jenna Lofton, StockHitter.com

Jenna’s Bottom Line
Free cash flow is the hardest number on a financial statement to manipulate. Earnings can be shaped by accounting choices. Cash either showed up in the bank or it did not. That is why free cash flow yield is the metric I trust most, and why the fact that the S&P 500’s free cash flow yield just fell below 2 percent, near its lowest level in decades, is one of the more important data points in the market right now.
Key Takeaways
- Free cash flow equals operating cash flow minus capital expenditures. It represents the actual cash a business generates after paying for what it needs to maintain and grow.
- The S&P 500’s free cash flow yield has fallen below 2 percent as of July 2026, near its lowest level in decades. A significant driver is the enormous capital expenditure surrounding the AI buildout, as hyperscalers spend hundreds of billions annually on data centers, chips, and power infrastructure.
- Free cash flow yield divides a company’s free cash flow by its market cap, producing a percentage that functions like an earnings yield but is harder to distort through accounting choices.
- A falling FCF yield does not automatically mean stocks are overvalued. It can also reflect a temporary surge in capital expenditure tied to a genuine growth investment cycle, which is exactly what is happening in AI infrastructure right now.
- Free cash flow is the primary input for discounted cash flow analysis, the most rigorous absolute valuation method available to individual investors.
What Free Cash Flow Actually Measures
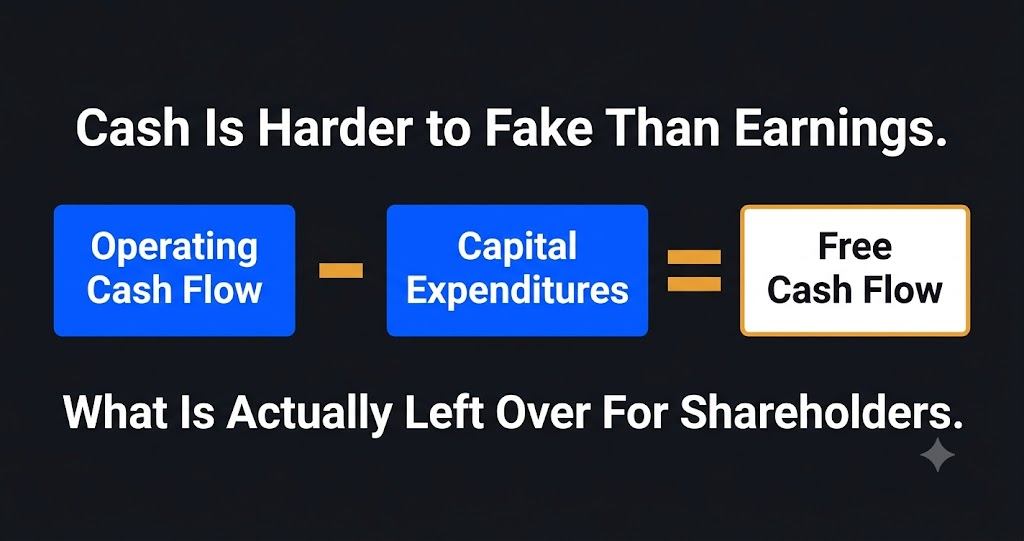
Free cash flow answers a specific and important question: after a business pays for everything it needs to keep running and growing, how much actual cash is left over?
The formula is straightforward. Take operating cash flow, the cash generated from a company’s core business operations, and subtract capital expenditures, the money spent on property, equipment, and infrastructure needed to maintain and grow the business. What remains is free cash flow, the cash genuinely available to pay dividends, buy back shares, pay down debt, or reinvest in the business at management’s discretion.
This differs meaningfully from reported earnings. Earnings include non-cash items like depreciation and can be shaped by accounting choices around revenue recognition, expense timing, and one-time adjustments. Cash flow is much harder to manipulate. The cash either arrived in the company’s bank account or it did not.
Why the S&P 500’s FCF Yield Just Hit a Decades Low

This is one of the more important valuation data points in the market right now, and most investors have not seen it discussed clearly.
As of July 2026, the S&P 500’s free cash flow yield has fallen below 2 percent, near its lowest level in decades. Part of that reflects the enormous capital expenditure surrounding the AI buildout. Several of the largest technology companies in the index are spending hundreds of billions of dollars annually on data centers, chips, networking equipment, and power infrastructure.
Here is why that matters for the formula above. When capital expenditure rises sharply, free cash flow falls even if operating cash flow is growing, because more of that operating cash is being reinvested rather than left over. A company spending aggressively on AI infrastructure today is trading near-term free cash flow for future earnings power. That is not automatically bad. It depends entirely on whether the capital expenditure generates a return that justifies the spending.
The risk is that a market-wide low free cash flow yield, sustained long enough, means investors are paying a historically high price for a shrinking pool of actual distributable cash. The opportunity is that if the AI capital expenditure cycle produces the earnings growth it is targeting, today’s depressed free cash flow yield looks like a temporary dip in a long-term uptrend rather than a genuine valuation warning.
Free Cash Flow Yield: How to Use It
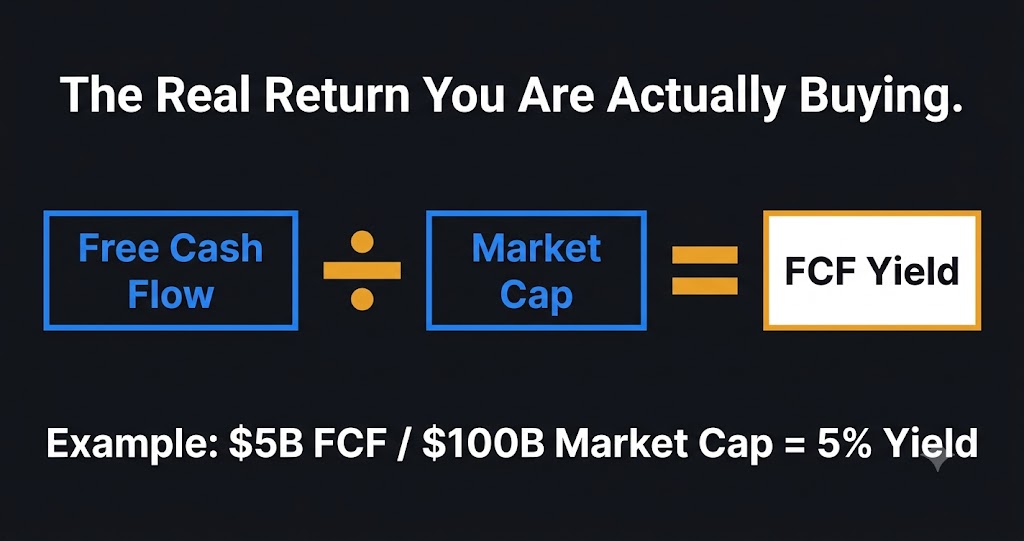
Free cash flow yield converts the raw free cash flow number into a percentage you can compare across companies and against the broad market, similar to how P/E works but with cash instead of accounting earnings as the input.
The formula divides free cash flow by market cap. A company generating $5 billion in annual free cash flow with a $100 billion market cap has a 5 percent free cash flow yield. In the current interest rate environment, a yield in that range is genuinely attractive. A company generating $500 million in free cash flow at the same $100 billion market cap has only a 0.5 percent yield, which requires very high confidence in future growth to justify.
Broadcom (AVGO) is one of the clearest examples in the current market of exceptional free cash flow generation. Its trailing free cash flow margin sits around 42 percent, well above the semiconductor peer median of approximately 20 percent. That cash generation is what allows the company to fund an aggressive AI chip development program, pay a rapidly growing dividend, and repurchase shares simultaneously, all without straining the balance sheet.
Free Cash Flow Margin: The Efficiency Signal
Free cash flow margin divides free cash flow by revenue, telling you what percentage of every revenue dollar converts into distributable cash. It is one of the fastest ways to assess the underlying quality and efficiency of a business.
A software company converting 35 to 40 percent of revenue into free cash flow is operating an exceptionally efficient business model. A capital-intensive infrastructure company converting 10 to 15 percent of revenue into free cash flow may still be a high-quality business, but the comparison has to account for the different capital requirements of the two business models.
Tracking free cash flow margin over multiple quarters reveals whether a business is becoming more or less efficient as it scales. Margin expansion alongside revenue growth is one of the strongest signals of genuine operating leverage. Margin compression during a revenue growth phase deserves scrutiny into whether the growth is being purchased at an unsustainable cost.
Experience Transparency
Free cash flow saved me from a mistake early in my career that reported earnings alone would not have caught. A company I was evaluating showed steadily growing net income for several consecutive years. When I pulled the cash flow statement, operating cash flow was flat and capital expenditure was rising to keep the business running at all. The earnings growth was coming from accounting adjustments, not real cash generation. I passed on the position, and the stock struggled significantly over the following two years once the market caught on to the same gap. That experience is why free cash flow is the first thing I check after market cap on every stock I evaluate seriously.
Discounted Cash Flow: Turning Free Cash Flow Into Intrinsic Value
Discounted cash flow analysis, commonly called DCF, is the most rigorous absolute valuation method available and it is built entirely on free cash flow projections.
The process projects a company’s expected free cash flow over the next five to ten years, then discounts those future cash flows back to today’s dollars using a required rate of return that reflects the riskiness of the business. The sum of those discounted cash flows, plus a terminal value representing cash flow beyond the projection period, produces an estimate of what the entire business is intrinsically worth today.
DCF is powerful because it forces explicit assumptions about growth rates, margins, and the discount rate, all of which can be stress-tested. It is also sensitive to those same assumptions, meaning small changes in growth rate or discount rate can swing the output dramatically. I use DCF as one input among several, never as a single definitive number, and I always run a base case, a bear case, and a bull case rather than trusting a single point estimate.
For our complete framework on building a full valuation picture using multiple methods together, see our pillar guide to how to value a stock.
Free Cash Flow and AI Infrastructure Stocks
Free cash flow analysis is particularly important right now because the AI infrastructure buildout has created a genuine divide between companies funding growth from internal cash generation and companies relying on external capital.
Broadcom’s ability to fund its custom AI chip programs while maintaining a 42 percent free cash flow margin represents one end of the spectrum. Earlier-stage AI infrastructure companies still scaling toward profitability, including newer entrants like Nebius (NBIS), represent the other end, where growth is currently funded through a combination of operating cash flow and external capital raises rather than free cash flow generation alone.
Neither position is automatically better or worse. A company still in heavy investment mode can be a legitimate opportunity if the capital is being deployed productively. But understanding which category a company falls into changes what questions you should be asking and what risks you should be monitoring. For our full analysis of the AI infrastructure investment theme, see our guide to best AI stocks to buy in 2026.
When Free Cash Flow Misleads You
Free cash flow is not immune to distortion, even though it is harder to manipulate than earnings.
Timing of capital expenditure can create artificial volatility in any single quarter’s free cash flow number. A company that delays a planned facility investment from one quarter to the next will show artificially high free cash flow in the first quarter and artificially low free cash flow in the second, without any actual change in the underlying business. Always look at trailing twelve-month free cash flow rather than a single quarter to smooth out this kind of timing noise.
Working capital changes can also swing quarterly free cash flow significantly. A large one-time change in receivables, payables, or inventory can inflate or deflate operating cash flow in ways that do not reflect the sustainable underlying trend. Reading the full cash flow statement, not just the headline free cash flow figure, reveals whether a strong or weak quarter reflects the core business or a temporary working capital shift.
For investors who want institutional-grade analysis that adjusts for these kinds of accounting and cash flow distortions, Hidden Alpha from Joel Litman uses Uniform Accounting methodology specifically designed to normalize cash flow and earnings figures across companies with different accounting treatments, capital structures, and reporting choices.
Wall Street Reality Check
Wall Street analysts talk about earnings constantly and free cash flow far less often, which is not an accident. Earnings estimates are easier to influence through guidance conversations, and companies have more discretion over the accounting choices that shape reported earnings than they do over actual cash movements. A management team that consistently beats earnings estimates while free cash flow stagnates or declines is telling you something the headline numbers are not. The S&P 500’s free cash flow yield falling to a decades-low level is exactly the kind of data point that gets far less coverage than a single company’s earnings beat, despite being arguably more important for understanding what investors are actually paying for across the market as a whole.
Bottom Line
Free cash flow is the number that is hardest to fake, which makes it the number I trust most when everything else in a financial statement is telling a conflicting story. The S&P 500’s free cash flow yield falling below 2 percent, near a decades-low level, is a genuinely important signal worth understanding rather than ignoring. Whether it reflects dangerous overvaluation or a temporary capital investment surge that pays off depends entirely on whether the AI buildout generates the returns it is targeting. Track free cash flow trends, not just quarterly snapshots, and you will see that answer emerge well before it shows up in a headline earnings report.
Further Reading
Disclaimer: This article is for informational and educational purposes only and does not constitute financial advice. StockHitter.com and Jenna Lofton are not registered investment advisors. All investing involves risk, including the potential loss of principal. Past performance does not guarantee future results. Always conduct your own due diligence and consult a licensed financial professional before making investment decisions. Jenna Lofton holds positions in PLTR and NBIS. Some links on this page may be affiliate links, meaning StockHitter.com may receive compensation if you subscribe to a service at no additional cost to you. This does not influence our editorial opinions.