

Originally published July 30, 2026 | Updated October 10, 2026 | By Jenna Lofton, StockHitter.com

Jenna’s Bottom Line
The price to sales ratio exists to solve one specific problem: how do you value a company that has no earnings yet? It is the right tool for high-growth businesses and the wrong tool the moment you forget to check gross margin. Skip that step and you will compare two completely different types of businesses as if they were interchangeable.
Key Takeaways
- The price to sales ratio divides a company’s market cap by its annual revenue. Unlike P/E, it works even when a company has no profit or negative earnings.
- An index P/S ratio needs a dated source and a consistent calculation method. Changes in sector weights and profit margins can shift the comparison over time.
- P/S only becomes meaningful once you factor in gross margin. A dollar of revenue from an 85 percent gross margin software business is worth far more than a dollar of revenue from a 30 percent gross margin retailer.
- Sector context matters enormously. Compare businesses with similar economics using the same source, observation date, and trailing or forecast revenue basis.
- P/S is a screening tool, not a final valuation. It tells you what the market is paying per dollar of revenue. It does not tell you whether that revenue will ever convert into real profit.
What the Price to Sales Ratio Actually Measures
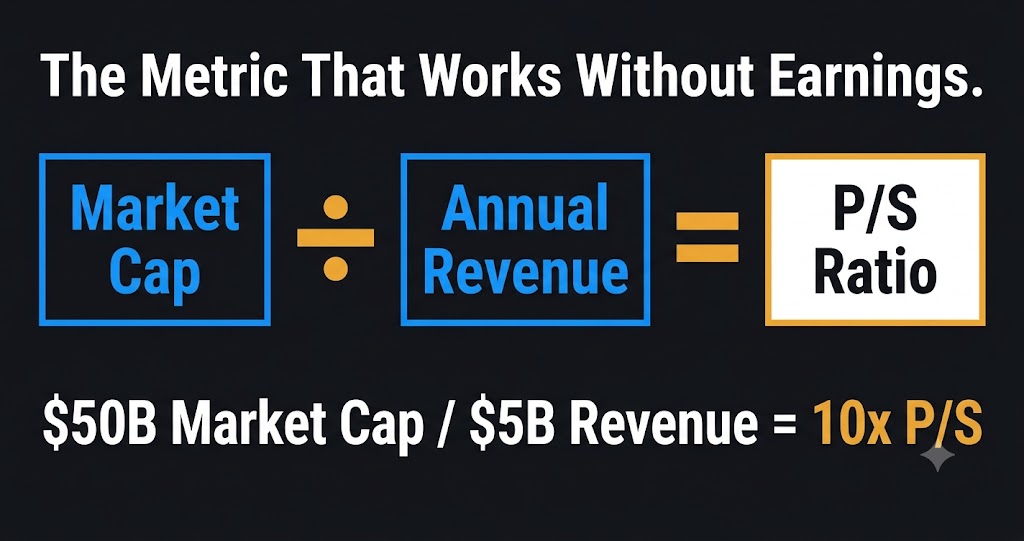
The price to sales ratio answers a simpler question than P/E: how much is the market paying for each dollar of a company’s annual revenue?
The formula divides a company’s market capitalization by its total revenue over the trailing twelve months. A company with a $50 billion market cap generating $5 billion in annual revenue trades at 10 times sales. You are paying $10 for every $1 the business brings in the door.
P/S has one crucial advantage over P/E: it works even when a company has no earnings. Revenue is almost always positive, even for a business that is losing money on an operating basis. That makes P/S the default starting metric for high-growth companies, pre-profitability businesses, and cyclical companies during earnings downturns.
Reading the Market Backdrop
An index P/S ratio is useful context, but it is not a fair-value target. Check the observation date, whether the calculation uses trailing or forecast revenue, and how the data provider aggregates companies. Changes in sector weights, margins, and growth expectations can shift the ratio over time.
The S&P 500’s business mix has changed considerably over the decades. A higher weighting toward high-margin software and services can support a different revenue multiple than a manufacturing-heavy index. That does not give investors permission to pay any price. It gives them another question to ask.
Why Gross Margin Changes Everything
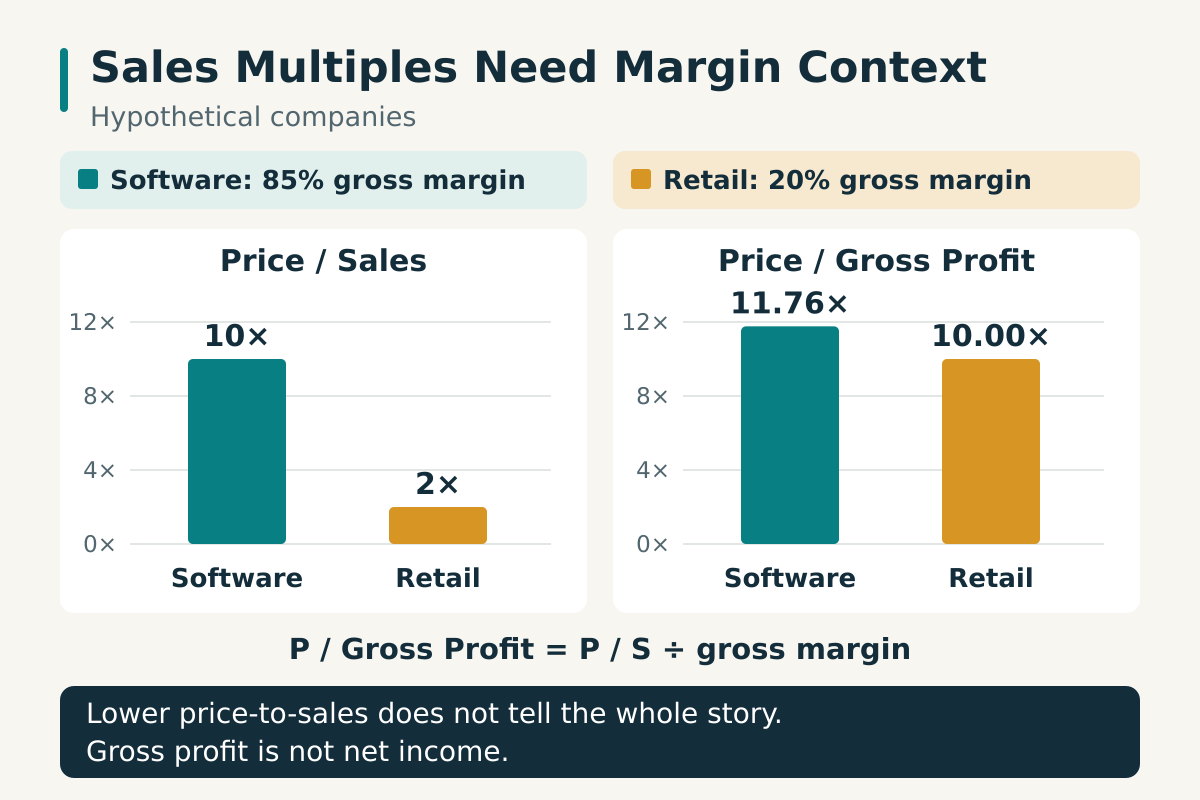
This is the single most important adjustment to make before using P/S to compare two companies, and it is the step most retail investors skip entirely.
A dollar of revenue is not worth the same amount across every business. A software company with 85 percent gross margins converts $0.85 of every revenue dollar into gross profit before operating expenses. A retailer with 30 percent gross margins converts only $0.30 of that same revenue dollar. Comparing their P/S ratios without adjusting for that gap is comparing apples to a completely different fruit.
Divide P/S by gross margin expressed as a decimal to calculate price to gross profit. A software company at 10 times sales with an 85 percent gross margin trades at about 11.76 times gross profit. A retailer at 2 times sales with a 20 percent gross margin trades at 10 times gross profit. The software company still carries the higher multiple, although the gap is much smaller than the headline P/S ratios suggest. Gross profit still has to cover operating expenses, taxes, and other costs.
Sector Benchmarks: Why Comparisons Only Work Within Categories
Just like P/E, price to sales ratios vary enormously by sector and comparing across sectors without adjustment produces misleading conclusions.
Aswath Damodaran’s January 2026 U.S. industry dataset reports P/S ratios of 15.46 for semiconductors, 7.49 for semiconductor equipment, and 11.01 for system and application software, compared with 2.01 for general retail. These are dated industry aggregates from one dataset, not current quotes or a median of individual companies.
The comparison that matters is sector peers first, with a matching date and calculation method. Even then, check the margins and the growth assumptions hiding behind the multiple.
Comparison Check
A software business at 8 times sales carries four times the revenue multiple of a hardware business at 2 times sales. If its gross margin is only about three times higher, it still trades at a higher price to gross profit. Better margins can narrow a valuation gap without eliminating it. Check the arithmetic before declaring either stock cheaper.
How AI Infrastructure Stocks Trade on P/S
The current AI infrastructure cycle has produced some of the most closely watched P/S ratios in the market, and understanding why requires applying the framework above rather than reacting to the headline number.
Palantir Technologies (PLTR) illustrates why growth and margins belong beside the revenue multiple. In Q2 2026, revenue increased 93 percent year over year and GAAP gross margin was 85 percent, or 86 percent excluding stock-based compensation. Those figures help explain investor interest, but they cannot establish that any particular share price is reasonable. Compare a dated P/S calculation with peers, expected growth, and the earnings and cash flow already being generated.
Nebius (NBIS) presents a different case entirely. As a capital-intensive AI cloud infrastructure business with lower gross margins than pure software companies, its P/S ratio needs to be evaluated against infrastructure and cloud services peers, not against high-margin software businesses. The same raw multiple carries a different meaning depending on what type of business is generating the revenue.
For our full analysis of how valuation applies specifically to AI infrastructure names, see our guide to best AI stocks to buy in 2026.
When P/S Is the Wrong Tool
P/S has real limitations that are worth understanding before leaning on it too heavily.
It ignores profitability entirely. A company can maintain an attractive P/S ratio for years while burning cash at an unsustainable rate. Revenue growth alone does not guarantee the business will ever generate real profit, and P/S provides no visibility into that question.
It ignores debt and capital structure. Two companies with identical P/S ratios can carry very different balance sheet risk if one is funded by debt and the other by equity. EV/Sales, which adds net debt into the numerator, corrects for this and is often the more precise version of the same idea for capital-intensive businesses. For a related metric that adjusts specifically for capital structure and depreciation, see our guide to EV/EBITDA explained.
For businesses with real, stable earnings, P/E and free cash flow yield remain more precise valuation tools than P/S. Use P/S as the entry point for companies where earnings-based metrics do not yet apply, then transition to earnings and cash flow based analysis once the business matures into consistent profitability. For our complete framework on free cash flow valuation, see our guide to free cash flow valuation.
How I Actually Use P/S in Practice
My process starts with confirming why I am using P/S in the first place. If the company has meaningful positive earnings, I lean on P/E ratio and free cash flow yield first, and treat P/S as a secondary sanity check.
If the company has minimal or negative earnings, P/S becomes the primary tool, but I never look at it in isolation. I pull the gross margin, compare the multiple against sector peers rather than the broad market, and check the revenue growth rate and its trajectory over the past several quarters. Read the earnings report to see whether stronger sales are also producing stronger margins and cash generation. A business trading at a high P/S with accelerating revenue growth and expanding gross margins is telling a very different story than one trading at the same multiple with decelerating growth.
For investors who want a research service specifically built around identifying accelerating growth companies before their revenue multiples get fully priced in by the broader market, Louis Navellier’s Growth Investor uses a quantitative screening process that weighs revenue growth momentum heavily, which pairs naturally with P/S-based analysis on pre-profitability businesses.
Wall Street Reality Check
During every growth stock bull market, P/S becomes the metric of choice precisely because it flatters companies that have no earnings to scrutinize. Analysts and promoters lean on revenue multiples when profit-based metrics would tell a less flattering story. That does not make P/S useless. It makes it a metric that requires more discipline to use correctly than P/E, not less. The businesses that eventually justify a premium P/S multiple are the ones where revenue converts into real gross profit and, eventually, real operating profit. The ones that do not make that conversion are the ones investors remember as cautionary tales a few years later.
Bottom Line
The price to sales ratio fills a genuine gap that P/E cannot: valuing companies before they reach consistent profitability. Used correctly, it requires checking gross margin, comparing against sector peers rather than the broad market, and tracking revenue growth trajectory alongside the raw multiple. Used carelessly, it becomes a way to make an expensive, unprofitable business look reasonable simply because the denominator is revenue instead of earnings. The metric is only as good as the context you bring to it.
Further Reading
Disclaimer: This article is for informational and educational purposes only and does not constitute financial advice. StockHitter.com and Jenna Lofton are not registered investment advisors. All investing involves risk, including the potential loss of principal. Past performance does not guarantee future results. Always conduct your own due diligence and consult a licensed financial professional before making investment decisions. Jenna Lofton holds positions in PLTR and NBIS. Some links on this page may be affiliate links, meaning StockHitter.com may receive compensation if you subscribe to a service at no additional cost to you. This does not influence our editorial opinions.