

Should you use Stock Rover or Finviz for stock research?
Stock Rover is the stronger fit when your stock screen is the beginning of a deeper fundamental investigation. Finviz is the easier place to start when you want to narrow a U.S.-listed stock universe, inspect the market visually, and decide what deserves a closer look.
That recommendation depends on the job you actually need done. A long-term investor who compares several years of business results has different needs from someone building a short list before the opening bell. Buying the biggest plan because it has the most features is how a research subscription becomes an unusually expensive bookmark.
Both products have free access and paid upgrades. Both also do more than their reputations suggest. The useful comparison is research depth, saved work, data timing, exports, and the cost of the tier that can handle your routine.
Stock Rover vs Finviz at a glance
| Decision | Stock Rover | Finviz |
|---|---|---|
| Main reason to consider it | Investigating businesses, comparing historical fundamentals, and organizing portfolio research | Finding candidates and reviewing the U.S. market through screens, charts, and maps |
| Free starting point | Basic research access; paid tools require the appropriate plan | Useful public stock screener and market views |
| Regular paid price (before promotions) | Premium: $34 monthly or $348 annually | Elite: $39.50 monthly or $299.50 annually |
| Historical/equation screening | Premium Plus and higher | Check whether the available presets/custom filters express your exact condition |
| Fundamental history | Five years in Premium; ten in Premium Plus; twenty in Ultimate | Elite advertises eight years of financial statements |
| Exports | Paid-plan quotas; table CSV export unavailable during trial | Elite includes Excel/CSV exports |
| Charting and alerts | Fundamental comparisons and plan-dependent research tools | Elite includes interactive multi-layout charts and stock/screener alerts |
Advertised features were checked on October 19, 2026; regular prices, renewal and trial information were rechecked on November 16, 2026. The table shows regular U.S.-dollar subscription prices before any applicable tax, not introductory offers. The Stock Rover plan page separates monthly, annual, and two-year billing. Treat those as different commitments.
What happens after a stock passes your screen?
Picture the same starting question: Which profitable U.S.-listed businesses deserve more research?
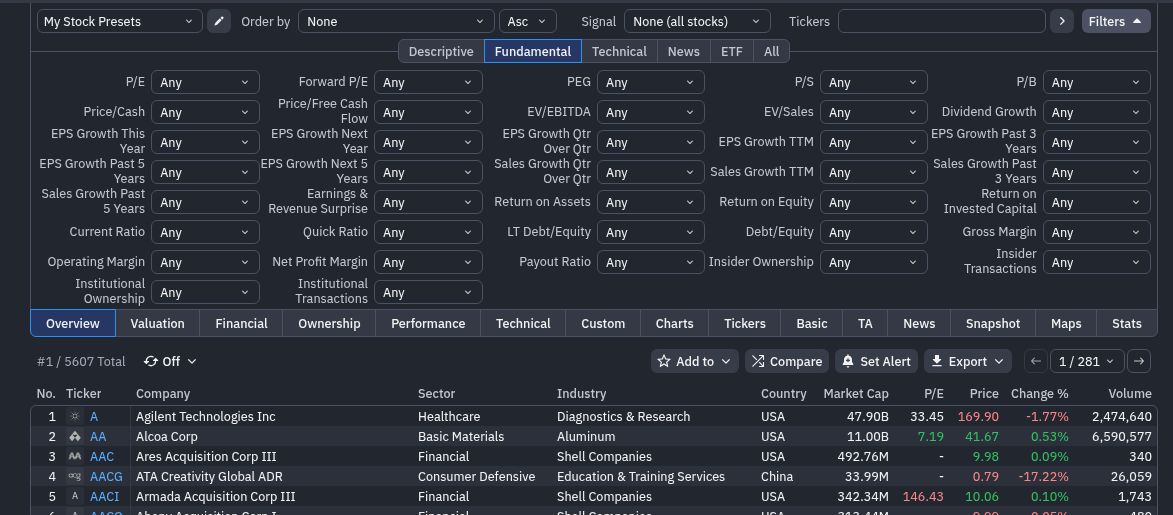
With Finviz, the attraction is a compact path from filters to a results list and then a stock overview. You can inspect a chart, compare headline ratios, check a sector, and decide whether to investigate further. If you regularly stop at that stage and do the deeper work in company filings, the free screener may already solve a meaningful part of your problem.
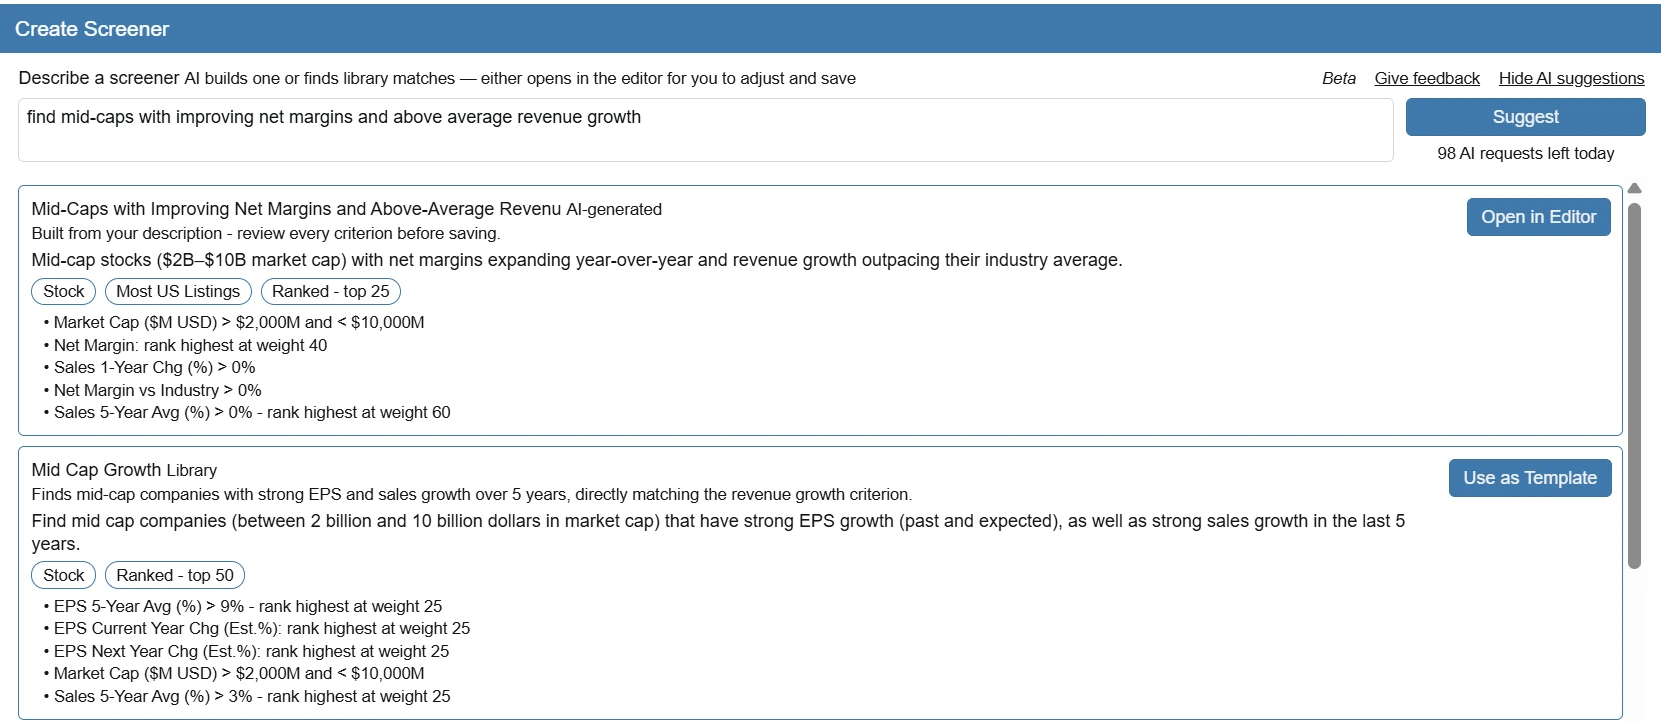
Stock Rover becomes more interesting when the follow-up questions pile up. Has a margin improved over several years? Is the current valuation unusual relative to the company’s own history? Can you rank candidates against a set of financial criteria and preserve that research alongside a portfolio?
Those questions explain why historical data and equation screening matter. A snapshot tells you what a number is now. A historical condition can help you ask how that number changed. Neither one tells you whether management’s explanation is credible. The annual report still gets a seat at the table.
Our guide to reading an earnings report explains how to check revenue, margins, cash flow and guidance against the company’s disclosures.
My recommendation is to write down your three most common follow-up questions before shopping. If all three concern business history or portfolio context, investigate Stock Rover. If they concern finding candidates and checking the current market picture, start with Finviz.
The price comparison changes with the billing cycle
At our November 16 check, Finviz advertised a Black Friday offer of $149 for the first year, then $299.50 annually. Stock Rover’s announced sale runs November 23–30 for new subscribers’ first annual or two-year term, with renewal at regular prices. These introductory offers are separate from the regular-price comparison below; check eligibility and the total at checkout.
At regular prices, Finviz Elite is cheaper than Stock Rover Premium on the annual prices above: $299.50 versus $348, a difference of $48.50. On month-to-month billing, Stock Rover Premium costs less: $34 versus $39.50.
That small reversal is worth noticing. Comparing one product’s annual equivalent with the other’s cancellable monthly rate can make an ordinary subscription comparison look like a magic trick.
Stock Rover Premium Plus costs $70 monthly or $588 annually. The annual upgrade from Premium is $240. That buys access to capabilities such as equation-based and historical screening, rather than simply a different badge on your account.
Stock Rover’s two-year Premium option is $576 paid for two years, displayed as a $24 monthly equivalent. It is not a $24 month-to-month plan. A longer commitment is only a bargain if you keep using the product.
For a small research budget, the first comparison should be free versus paid. Identify the exact task blocked by the free version. If you cannot name it, keep your wallet comfortably unemployed for another week.
Exports and limits can matter more than another metric
A platform can have the data you want and still be a poor fit for your workflow if you repeatedly run into export or table limits.
Stock Rover’s published plan limits list 10 monthly exports and 250 table rows for Premium, compared with 90 exports and 500 rows for Premium Plus. Ultimate raises those limits to 500 exports and 1,000 rows. These are usage limits, not a promise that every data field can be exported in every context.
Someone who exports a research list once each weekend may be comfortable with ten monthly exports. Someone who produces several versions a day should check the quota before paying. Count an export as a work action, not as a calendar day.
Finviz Elite includes exports, but that does not establish unrestricted bulk downloading or redistribution rights. If you need data for a commercial tool, a large automated pipeline, or publication, verify the applicable license and access terms separately.
Stock Rover’s trial does not allow table CSV exports. If exports are essential to your workflow, confirm the format and limits before paying; the trial won’t let you test that function.
Finviz has charts, alerts, and financial history too
It would be misleading to describe Finviz as nothing more than a page of screening boxes. Its current Elite feature and pricing page lists interactive chart layouts, financial statements, real-time stock quotes, and alerts for events including new screener matches.
That changes the buying decision. If your main frustration is repeatedly checking whether a company meets a screen, an alert may be more valuable than a longer historical data series. If you want a quick view of several charts, compare the current charting package rather than relying on an old review screenshot.
The same caution applies to data delay. Finviz currently says regular stock quotes are delayed by one minute, with real-time stock quotes in Elite. Also, real-time stock quotes do not mean every asset or every fundamental figure updates on the same schedule.
A fair comparison task you can repeat
Use a small, clearly defined research assignment during your evaluation:
- Match the universe. Use U.S.-listed common stocks, the same market-cap floor, and the same treatment of funds, depositary receipts, and missing data wherever the controls permit.
- Choose comparable fields. Start with positive trailing earnings and an illustrative trailing P/E range, such as 10 to 25. These are test conditions, not a stock-buying strategy.
- Match the definitions. A trailing ratio and an estimated forward ratio answer different questions. Check reporting periods and units rather than matching labels alone.
- Inspect three overlapping results. Compare the displayed data with the underlying company’s latest filing. Investigate differences before deciding that one screener is wrong.
- Add your real follow-up. For example, compare several years of profit margins or ask whether a historical financial condition can be expressed. Record the tier required.
- Save and revisit. Can you recover your notes, filters, and list? If export matters, record whether it was actually tested or only documented.
Do not score the winner by the number of stocks returned. Different coverage, update times, definitions, and filters can create different lists. The valuable result is understanding why.
Historical screening is not the same as a clean backtest
Stock Rover’s own screening documentation says it does not currently offer a dedicated backtesting feature. It describes a historical-screening workaround and notes that it does not account for survivorship bias.
That matters if you select today’s successful companies and then admire how those survivors performed years ago. The stocks that disappeared may be missing from the exercise. A chart of current screen members is also different from recreating which stocks would actually have qualified on each historical date.
Use these tools to organize research. Do not turn a handsome historical chart into a claim that a screen would have reliably beaten the market.
Which one should you choose?
- Start with Finviz free if you want a manageable research list and do not yet have a concrete reason to pay.
- Consider Finviz Elite if current stock data, alerts, charts, or exports remove a recurring bottleneck.
- Consider Stock Rover Premium if you want a more organized fundamental-research and portfolio workspace and its limits fit your routine.
- Consider Stock Rover Premium Plus if historical/equation screening is central to your process. Paying for that specific capability makes more sense than upgrading just because the word “Plus” looks reassuring.
Check the trial terms carefully. Stock Rover says its 14-day trial requires no card and reverts to Free. Finviz has a seven-day Elite trial page, but we could not reconfirm its card requirement or conversion terms from the public page. Check those terms before starting. Its paid plans renew automatically unless cancelled. Finviz offers refunds during the initial 30 days upon written request; its instructions say to cancel first and then contact support. Stock Rover’s paid plans also renew automatically. Its published refund policy says it does not issue refunds; cancelling stops the next renewal, while access continues through the paid term.
The best choice is the one that helps you answer your next research question accurately and consistently. More metrics can be useful. More subscriptions are very good at being more subscriptions.
Research note: This comparison is based on current official pricing, feature, and help documentation. It does not claim firsthand paid-account testing, measured speed advantages, or investment results. Product terms and access can change.