

Which Finviz filters are useful for long-term investors?
For a simple long-term research list, start with four illustrative Finviz filters: market capitalization above $2 billion, average volume above 500,000 shares, positive five-year sales growth, and a positive net profit margin. Then investigate the businesses behind the results.
Open a stock screener and suddenly there are enough dropdowns to make ordering coffee look straightforward. Market cap. Margins. Growth. A mysterious amount of green.
These thresholds are editorial choices for this exercise. They have not been shown here to produce superior returns, identify bargains, or suit every investor. They narrow the research pile. That’s already a useful job, especially when the alternative is opening dozens of tabs and forgetting why.
Build the screen with free preset filters
The settings below worked in Finviz’s free, logged-out stock screener when checked on October 19, 2026. Menus and access can change.
Step 1: Open the screener and clear old filters
Open the Finviz stock screener. Clear previous filters so you are starting clean. A forgotten filter can quietly veto businesses you meant to investigate. Expand the filters if necessary.
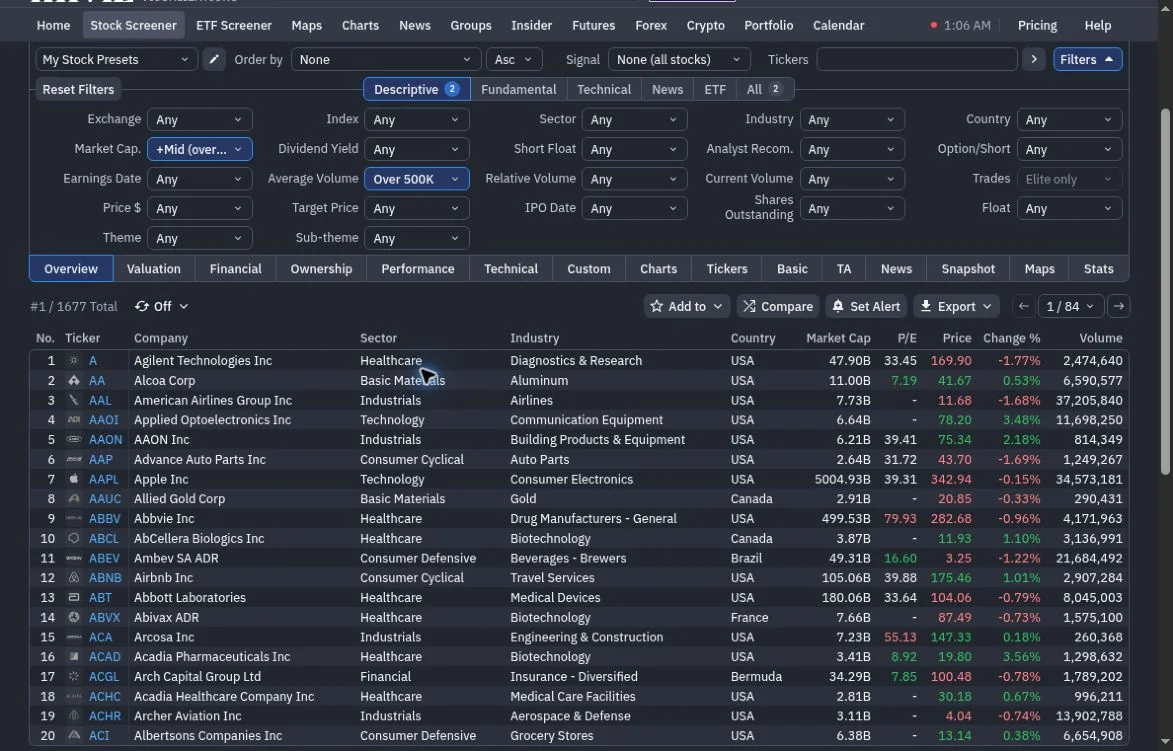
Step 2: Set the two Descriptive filters
Choose the Descriptive tab. Set Market Cap. to +Mid (over $2bln) and Average Volume to Over 500K.
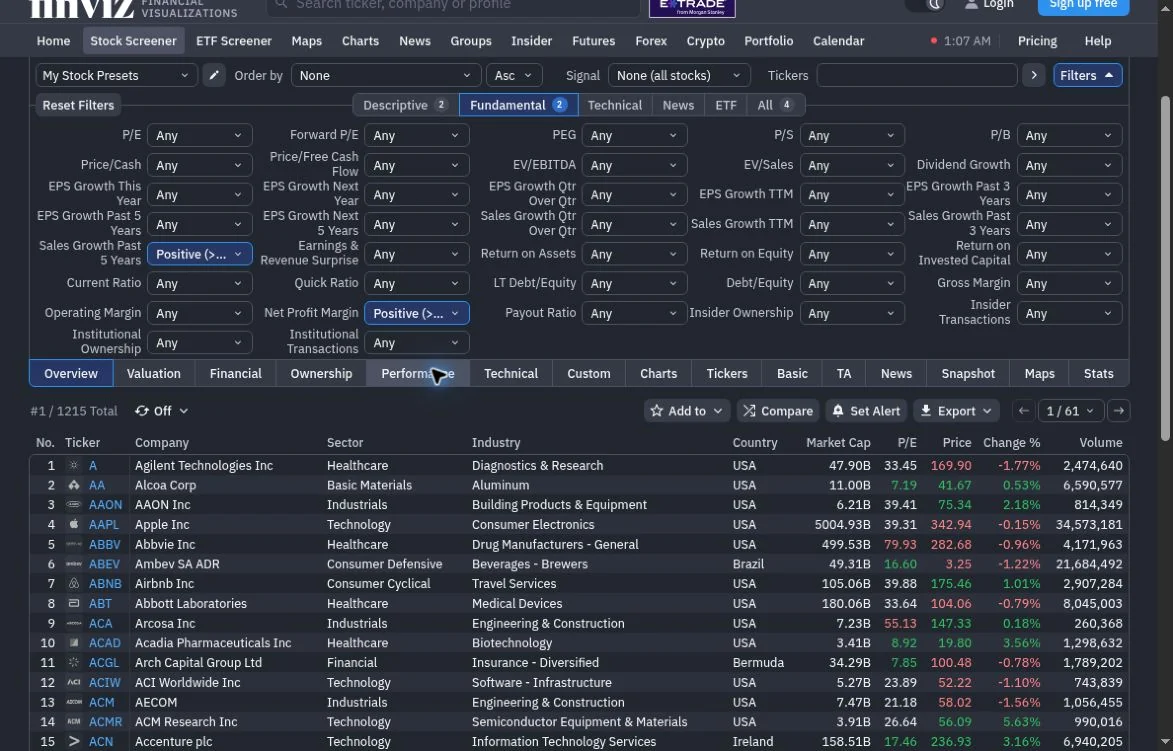
Step 3: Set the two Fundamental filters
Switch to Fundamental. Set Sales Growth Past 5 Years and Net Profit Margin to Positive (>0%). Leave unrelated filters at their defaults.
| Tab | Field | Selection |
|---|---|---|
| Descriptive | Market Cap. | +Mid (over $2bln) |
| Descriptive | Average Volume | Over 500K |
| Fundamental | Sales Growth Past 5 Years | Positive (>0%) |
| Fundamental | Net Profit Margin | Positive (>0%) |
Or open the completed example screen and check the selections yourself. The companies and result count will change. Any names visible in the screenshots are interface examples, not recommendations.
What each setting does, and what it misses
1. Market capitalization above $2 billion
Market capitalization measures the market value of a company’s outstanding shares. This setting includes companies above the cutoff, rather than only a middle-sized band. Finviz explains the measure in its screener definitions.
The purpose here is to keep smaller companies outside this particular exercise. There is nothing scientifically special about $2 billion. A company doesn’t become financially sturdy just by crossing the line. A strong smaller business can also be excluded. If small companies are your research focus, this filter works against your goal.
2. Average volume above 500,000 shares
Finviz measures average daily share volume over the recent three months. The filter removes stocks below the selected activity level. It measures shares, not dollars, and it does not guarantee a narrow bid-ask spread or an easy sale during a rough market.
Think of it as a preliminary trading-activity check. Two stocks with identical share volume can have very different dollar trading activity because their prices differ. A quiet, well-run company may fail this screen. A heavily traded troubled company may pass. Lots of activity tells you that people are trading, not that everyone has made a wise decision.
3. Positive sales growth over the past five years
This selects a positive historical growth measure. It does not require sales to rise every year or establish that the latest quarter was healthy.
When a company makes the list, ask what drove the growth. More customers? Higher prices? An acquisition? Check the recent annual figures as well as the five-year summary. An aggregate number can hide a bumpy route. Five years of growth compressed into one box is convenient, but the box leaves out an awful lot of plot.
The filter can also leave out businesses with unavailable history or declining sales that deserve a separate investigation. A turnaround screen would need a different starting point.
4. A positive net profit margin
Net profit margin relates net income to revenue. Selecting a positive value screens for reported profitability on this measure. It does not demand a particular margin percentage.
That deliberately modest hurdle still excludes loss-making companies, including some investing heavily in expansion. Meanwhile, a positive number deserves questions about unusual gains, taxes, and recurring operations.
Also check cash generation. Accounting profit and cash flow answer different questions, as the SEC’s financial-statement guide explains. A green profitability cell cannot do the cash-flow statement’s homework.
Compare businesses within their industries
Once you understand the initial results, choose an industry you can explain and compare companies doing similar work. The SEC notes that useful financial-ratio benchmarks vary by industry. Comparing an industrial manufacturer’s margins with a software company’s can obscure more than it reveals.
For that reason, this starter screen does not impose one universal P/E ceiling or debt-to-equity limit. A low earnings multiple needs an explanation. So does a high one. Debt deserves a look at the actual obligations, repayment dates, interest costs, and resources available to meet them.
Write down why you add another restriction. “I want to compare established businesses in this industry” is a research purpose. “I want the list to contain exactly five stocks” is mostly tidying. It’s understandable to want a neat list. Unfortunately, businesses have never been particularly cooperative about our formatting preferences.
If a promising name disappears, remove one filter at a time to see why. Missing a cutoff is useful information about your screen, not a verdict on the business.
Turn a result into a research file
Pick one company you understand well enough to investigate. For a U.S. domestic reporting company, begin with its latest 10-K, then review the latest 10-Q and relevant subsequent 8-K reports. Investor.gov explains these filings. Foreign issuers may use different forms.
- Explain the business. Identify its customers, main products, and sources of revenue. If the explanation still sounds like a slogan, keep reading. “Transforming tomorrow” is going to need a few more nouns.
- Trace the numbers. Compare several periods of revenue, earnings, and operating cash flow. Read management’s explanation of changes and the financial-statement notes.
- Look for what could go wrong. Review company-specific risks and debt obligations. Record what evidence would weaken your initial view.
- Assess the price separately. Compare valuation with relevant peers and the company’s own circumstances. Passing a profitability filter says nothing by itself about the price being attractive.
The SEC’s guide to reading a 10-K points readers toward the business description, risk factors, management discussion, and audited statements. Treat management’s account as something to examine critically. Filing with the SEC does not mean the agency endorses a company or vouches for its report.
Keep the screen date, filing periods, questions, and reasons for including or rejecting each company together. If a Finviz figure and a filing differ, check their periods and definitions before drawing conclusions. Our guide to reading an earnings report helps put revenue, EPS, margins and cash flow alongside one another once you’ve chosen a business to investigate.
Do you need Finviz Elite for this?
No paid subscription was needed for these four presets. Entering custom numerical bounds is an Elite feature. Finviz also advertises advanced filters, exports, and real-time data in its Elite feature list.
A promotional window may appear while you use the free screener; that happened during the interface check. Dismissing it allowed the preset workflow to continue. You do not need to start a trial to follow this example. The popup is allowed to be enthusiastic; you can still carry on with the four free presets. If you independently consider one, check the terms: Finviz says its trial converts to a paid subscription unless canceled before it ends.
If you’re also comparing stock-rating services, our Power Gauge Report review distinguishes its individual-stock ratings from the separate Chaikin Screener, which requires a higher-tier service. That distinction matters when deciding whether you want to look up a rating or build your own filtered list. The review contains affiliate links; StockHitter may earn a commission if you buy through them.
A useful list is the beginning
Keep the settings simple enough that you can explain every exclusion. Review a few businesses carefully, question the numbers, and accept that a screen can miss worthwhile companies while including unsuitable ones. You don’t have to use every dropdown just because somebody was kind enough to build it.
Our stock research tools overview can help you compare other research approaches. For now, one screen and one properly investigated company are plenty to work on.
This guide is educational and does not recommend any security or guarantee an investment outcome. Investing involves the risk of loss.