Chaikin Money Flow vs Power Gauge: What’s the Difference?
If you’ve spent any time looking into Marc Chaikin’s work, you’ve probably come across two things that sound related but aren’t exactly the same: the Chaikin Money Flow indicator and the Power Gauge rating system. I spent the first few months of my Power Gauge Report subscription confused about the difference. So let me save you the headache.
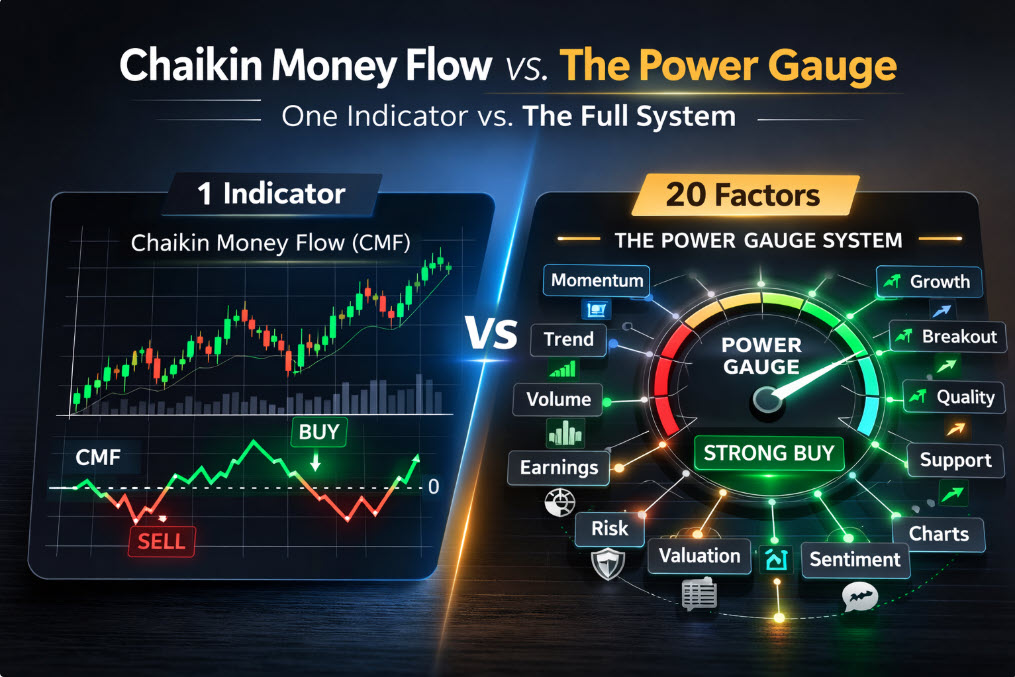
The short version: Chaikin Money Flow (CMF) is one ingredient. The Power Gauge is the whole recipe. Understanding how they work together (and where CMF fits in the hierarchy) completely changed how I evaluate stocks.
What Is the Chaikin Money Flow Indicator?
The Chaikin Money Flow is a technical indicator Marc developed decades ago, long before the Power Gauge Report existed. It measures buying and selling pressure over a 21-day period by looking at where a stock closes relative to its daily high-low range, weighted by volume.
The logic is simple. If a stock consistently closes near the top of its daily range on heavy volume, that’s accumulation. Institutions are buying. The CMF reads positive, and anything above the zero line is considered a sign of strength. If it keeps closing near the bottom of its range on heavy volume, that’s distribution. The big money is selling. CMF goes negative, signaling weakness.
What makes CMF different from basic volume analysis is the “where it closes” part. A stock can have a massive volume day, but if it closed near the low of that range, the volume was mostly selling pressure even if the price didn’t drop much yet. That divergence is what tips you off before the move actually happens.
There’s also a divergence signal that experienced traders watch for. If a stock’s price makes a higher high but the CMF makes a lower high and starts falling, that’s a sell signal. The price looks strong but the institutional money flow is weakening underneath. The opposite works for buys: price makes a lower low but CMF diverges with a higher low and starts rising.
Here’s the important part: CMF is free. You can pull it up right now on TradingView, StockCharts, or pretty much any charting platform. Marc made this indicator available to everyone. It’s not locked behind a paywall. That’s actually one of the reasons I trusted his paid service initially. A guy who gives away his best-known indicator for free probably isn’t worried about the quality of his paid tools.
What Is the Power Gauge Rating System?
The Power Gauge is the engine behind the Power Gauge Report and the Power Pulse screener that comes with the subscription. It analyzes 20 different factors across four categories and outputs a single rating: Very Bullish, Bullish, Neutral, Bearish, or Very Bearish.
The four categories break down like this:
Financials (5 factors): Return on equity, price-to-sales, debt-to-equity, free cash flow, and earnings quality. This tells you whether the company is fundamentally healthy right now.
Earnings (5 factors): Earnings growth trends, earnings surprises, analyst estimate revisions, projected earnings, and earnings consistency. This shows where the company is headed, not just where it’s been.
Technicals (5 factors): Price strength relative to the broader market, volume trends, and momentum over different timeframes. Standard technical analysis, but automated and weighted against 5,000+ stocks simultaneously.
Experts (5 factors): This is where Chaikin Money Flow lives, alongside insider buying/selling activity, analyst ratings, short interest, and institutional ownership changes. This is the “smart money” category.
Each factor gets a positive, neutral, or negative reading. The system weighs them all, runs the math, and produces the final rating. Simple on the surface. Complex underneath.
How CMF Fits Inside the Power Gauge (The Part Most People Miss)
This is the key insight that took me months to figure out, and it’s the thing that most reviews of the Power Gauge completely skip.
On paper, CMF is one of five factors inside the Expert category. That makes it one-twentieth of the overall rating. Just 5% of the total equation. But in practice, the Expert category punches way above its weight.
Here’s why. The other three categories (Financials, Earnings, Technicals) are largely backward-looking or present-tense. They tell you how the company is performing right now based on data that’s already public. The Expert category tells you what the people with the most money and the most information are actually doing with their capital. That’s forward-looking in a way the other factors can’t be.
When I was using the Power Pulse screener regularly, I noticed a pattern that kept repeating. Stocks where the overall Power Gauge was Bullish but the Expert component was weak tended to underperform. The fundamentals looked fine. Earnings looked fine. Technicals looked fine. But institutions were quietly stepping away. That divergence was almost always a warning sign.
The opposite also held true. Stocks where the Expert component was strong (high institutional accumulation, insider buying, positive CMF) but other factors were just okay often turned into the best performers. The smart money was seeing something that hadn’t shown up in the earnings reports or price charts yet.
I started thinking of the Expert factor as less of a tie-breaker and more of a super-vote. When everything else is mixed, the Expert component often determines whether a stock gets a Bullish or Neutral final rating. And that one-notch difference is the difference between a buy signal and a pass in Marc’s system.
What I Saw During the 2024 Market Volatility
During the August and September 2024 sell-off, I was watching several portfolio positions closely. What stood out was that the CMF component within certain holdings had started shifting negative roughly 10-14 days before the actual price drops hit.
The Financials still looked solid. Earnings hadn’t changed. Even the Technicals were holding up because the price hadn’t collapsed yet. But the Expert component was already deteriorating. Institutional money was flowing out before the headlines caught up.
That early warning window is what makes CMF valuable inside the Power Gauge specifically. As a standalone indicator on TradingView, CMF tells you “institutions are selling.” Inside the Power Gauge, that CMF shift drags the Expert score down, which pulls the overall rating from Bullish toward Neutral, which triggers a flag in the system before the 30% trailing stop loss even comes into play.
It’s a cascading signal: CMF shifts → Expert factor weakens → Power Gauge rating drops → subscriber gets alerted to a change. That sequence played out multiple times during my years with the service, and it’s the main reason I always checked the Expert component first in my weekly routine.
When CMF Alone Isn’t Enough
Here’s where people get into trouble. They discover the Chaikin Money Flow indicator on TradingView, see it works sometimes, and figure they’ve cracked the code without paying for anything.
CMF alone gives you one signal: are institutions buying or selling over the past 21 days? That’s useful. But it doesn’t tell you:
Whether the company deserves the buying pressure. Institutions pile into hype stocks too. CMF will show accumulation on a garbage company if enough funds are chasing momentum. The Financials and Earnings factors in the Power Gauge catch this. They’ll flag that the company’s debt is out of control or earnings are declining even while money is flowing in.
Whether the technical setup supports an entry. CMF can be positive while a stock is wildly overbought. The Technicals component checks relative strength, volume patterns, and momentum across multiple timeframes to tell you if you’re buying at the top of a run.
Whether insiders agree with the institutions. This is a big one. CMF tracks institutional flow, but the Expert category also looks at insider buying and selling separately. If institutions are accumulating but the CEO just dumped half his shares, those signals conflict. CMF alone would miss that. The Power Gauge catches it because insider activity is a separate factor within the same Expert category.
Whether the broader trend supports the trade. A stock might have great CMF, great fundamentals, and insider buying, but if the entire sector is in freefall, it probably doesn’t matter. The Technicals category evaluates the stock’s performance relative to the broader market, not just in isolation.
The Power Gauge doesn’t replace CMF. It contextualizes it. One indicator gives you a data point. Twenty factors give you a decision framework.
How to Use Both (Free and Paid) Together
If you’re not a Power Gauge subscriber, CMF is still worth adding to your charting setup. Here’s how I used it before I subscribed and how it led me to the paid service:
Step 1: Pull up CMF on TradingView for any stock you’re considering. Set it to the standard 21-day period. Look for readings above zero (accumulation) or below zero (distribution). Pay attention to divergences between price and CMF direction.
Step 2: If CMF is positive and the stock is breaking through a resistance level, that’s a confirmation signal. If CMF is negative while the stock breaks resistance, be skeptical. The breakout might not hold without institutional support.
Step 3: Watch for the divergence patterns. Price making higher highs while CMF makes lower highs is a classic sell warning. Price making lower lows while CMF makes higher lows is a potential buy setup. These divergence signals are what originally got me interested in Marc’s broader system.
If you are a subscriber, the Power Pulse screener does all of this automatically within the Expert component. You don’t need to manually chart CMF for every stock. The system runs it across 5,000+ tickers and factors it into the overall rating. The time savings alone justified the subscription for me.
The Bottom Line: One Indicator vs. Twenty Factors
Chaikin Money Flow is a genuinely useful free indicator. Marc built his reputation on it, and it deserves that reputation. It catches institutional buying and selling pressure before price movements confirm what’s happening underneath.
But CMF is one lens. The Power Gauge uses twenty. The real value of the paid system isn’t any single factor. It’s the weighting, the cross-referencing, and the automated screening across thousands of stocks that no individual investor could do manually every week.
If you’re already using CMF and finding value in it, the Power Gauge is the natural next step. It takes the indicator you already trust and wraps 19 additional factors around it, with the Expert category (where CMF lives) acting as the most forward-looking component in the system.
For my full breakdown of the Power Gauge Report subscription, including current portfolio performance and what’s actually in the members area, check out my complete Power Gauge Report review.
Frequently Asked Questions
Which money flow indicator is best?
It depends on what you’re trying to measure. The Chaikin Money Flow (CMF) is best for tracking institutional accumulation and distribution over a 21-day window. The Money Flow Index (MFI) is better if you want a volume-weighted RSI that flags overbought/oversold conditions. On-Balance Volume (OBV) is simplest if you just want a running total of volume direction. I’ve used all three, and CMF is the one I kept coming back to because it’s the most useful for spotting when smart money is quietly exiting before the price catches up. That said, none of them work great in isolation. That’s why Marc built the Power Gauge around 20 factors instead of relying on any single indicator.
What is the difference between money flow indicator and Chaikin money flow indicator?
They measure related but different things. The Money Flow Index (MFI) combines price and volume into an oscillator that bounces between 0 and 100, similar to RSI. Readings above 80 suggest overbought, below 20 suggests oversold. The Chaikin Money Flow (CMF) specifically measures where a stock closes within its daily high-low range, weighted by volume, over 21 days. CMF oscillates around a zero line: positive means accumulation, negative means distribution. The practical difference is that MFI tells you “is this stock overheated?” while CMF tells you “are institutions buying or selling right now?” For tracking smart money behavior, CMF gives you a more direct answer.
Is the Chaikin Money Flow indicator free?
Yes, completely free. You can add CMF to any chart on TradingView, StockCharts, Thinkorswim, or most other charting platforms. Marc Chaikin made the indicator publicly available. What’s behind the paywall is the Power Gauge system, which uses CMF as one of 20 factors in its rating algorithm and runs it across 5,000+ stocks automatically through the Power Pulse screener.
How reliable is the Chaikin Money Flow indicator?
Reliable for what it does, but limited on its own. CMF is good at catching institutional money flow shifts 10-14 days before price movements confirm them, based on what I’ve observed. Where it falls short is context. CMF won’t tell you if a company’s fundamentals are deteriorating, if insiders are selling, or if the whole sector is about to roll over. That’s why Marc built the Power Gauge around it rather than just selling the indicator. CMF is the signal. The other 19 factors are the confirmation.
Can I just use the free CMF indicator instead of paying for the Power Gauge?
You can, and it’s a reasonable starting point. If you’re comfortable doing your own fundamental research, checking insider transactions, and running technical analysis manually, CMF adds a valuable institutional flow layer on top of that work. But if you want all 20 factors automated across thousands of stocks with a single rating output, that’s what the Power Gauge subscription is for. I used CMF on its own for months before subscribing, and the time savings alone made the upgrade worth it for me. My full Power Gauge Report review breaks down exactly what’s included.
Jenna
Affiliate Disclosure: This article contains affiliate links to the Power Gauge Report. If you purchase through these links, I may receive a commission at no additional cost to you. All opinions are based on my actual subscription experience since 2021.